Decoding Forex Liquidity Dynamics: How Institutional Order Flow Really Moves G10 Markets
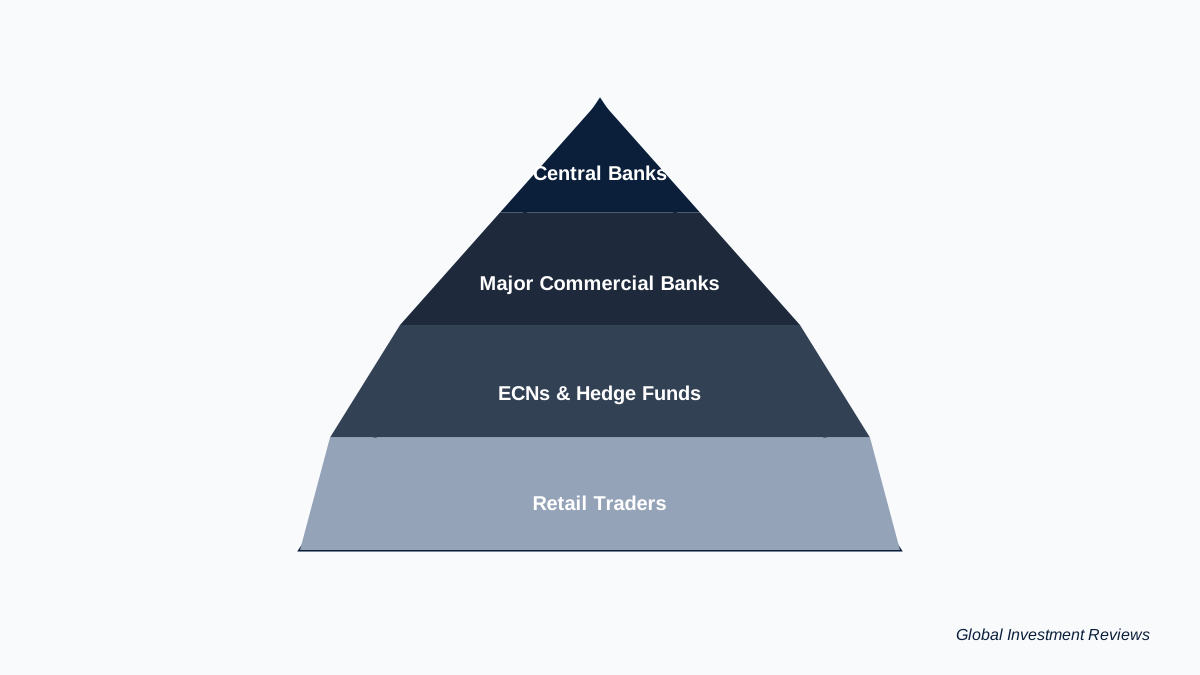
In the hierarchical structure of the global financial system, price action is merely the visible outcome of a much deeper, underlying mechanism: Forex Liquidity Dynamics. While retail methodologies prioritize geometric chart patterns, institutional participants—central banks, hedge funds, and prime brokers—operate within the realm of liquidity provision and absorption.
📊 Strategic Research Highlights
- • Liquidity Equilibrium: An in-depth analysis of how institutional liquidity depth acts as a critical buffer against systemic volatility in G10 currency markets.
- • Order Flow Imbalance (OFI): Understanding the mathematical and structural divergence between buy-side and sell-side liquidity pools within ECN environments.
- • Market Microstructure: Evaluating the strategic role of Tier-1 liquidity providers and the impact of increasing fragmentation in global dark pools.
- • Quantitative Risk Outlook: Leveraging historical volatility and cross-border capital flow data for high-level institutional strategic positioning.
The G10 currency complex represents the most liquid segment of the $7.5 trillion-a-day FX market. However, as global markets become increasingly fragmented, understanding the movement of institutional capital through order flow analysis is no longer optional—it is a critical requirement for capital preservation. This research-based report by Global Investment Reviews examines the structural dynamics of G10 liquidity and its implications for sophisticated investors.
The Mechanics of Forex Liquidity Dynamics in G10 Markets
To analyze Forex Liquidity Dynamics, one must first distinguish between “market depth” and “tightness.” In G10 pairs such as EUR/USD and USD/JPY, liquidity is characterized by narrow bid-ask spreads and the ability to absorb high-volume trades with minimal price slippage.
Research from the Bank for International Settlements (BIS) indicates that G10 currencies dominate global turnover due to their status as “Safe Haven” assets and their role in international trade settlement. However, liquidity is subject to Temporal Variance—it peaks during the London-New York overlap and reaches its nadir during the “Asian-Pacific gap.” For institutional-grade execution, understanding these liquidity cycles is paramount to reducing transaction costs.
Read also: How to Invest in USA Stock Market as an American in 2026
Quantitative Analysis of Institutional Order Flow
The core of Forex Liquidity Dynamics lies in the study of Order Flow Imbalance (OFI). Unlike centralized exchanges, the decentralized nature of the FX market means that order flow is fragmented across various pools. Institutional participants utilize Execution Algorithms (such as TWAP and VWAP) to mitigate market impact.
When a significant order flow imbalance occurs, the market enters a phase of “Price Discovery,” seeking the next concentrated Liquidity Cluster. These clusters typically reside at psychological round numbers or historical supply/demand zones. By monitoring these imbalances, analysts can identify where institutional “Stop-Hunts” are likely to occur—a process where the market intentionally triggers retail stop-losses to generate the necessary liquidity for a large-scale reversal.
Research Note by Raihan Ferdous: “In G10 trading, price does not move because of ‘sentiment’ alone; it moves to fulfill the unmet liquidity requirements of the largest participants.”
Market Microstructure and the Impact of Fragmentation
A critical component of modern Forex Liquidity Dynamics is the shift toward Electronic Communication Networks (ECNs) and dark pools. This fragmentation has led to a phenomenon known as “Phantom Liquidity,” where the liquidity displayed on the order book may vanish instantly during periods of high volatility.
Furthermore, the influence of The Federal Reserve’s Monetary Policy directly affects the Liquidity Premium. During periods of quantitative tightening, the cost of providing liquidity increases, leading to wider spreads even in the most liquid G10 pairs. Research suggests that as interest rate differentials fluctuate, the “carry trade” dynamics further complicate order flow, as capital shifts rapidly between high-yielding and low-yielding G10 assets.
Strategic Synthesis for Professional Portfolios
To navigate the complexities of Forex Liquidity Dynamics, a research-driven approach must incorporate the following pillars:
- Asymmetric Liquidity Analysis: Identifying zones where sell-side liquidity significantly outweighs buy-side liquidity (or vice versa) to predict potential “Flash Crashes.”
- Cross-Border Capital Flows: Utilizing IMF Global Financial Stability Reports to track the macro-environment of institutional risk appetite.
- Volatility Clustering: Understanding that periods of low liquidity often precede high-volatility expansions, allowing for strategic hedge placement.
The Enduring Value of Liquidity Research
In an era of high-frequency trading and AI-driven execution, Forex Liquidity Dynamics remains the most reliable metric for understanding market intent. By focusing on the structural mechanics of G10 order flow rather than superficial technical indicators, investors can gain a profound understanding of global capital movement. At Global Investment Reviews, we conclude that the mastery of liquidity research is the ultimate differentiator in achieving sustainable, risk-adjusted returns in the G10 currency markets.
See more: Gold and Critical Minerals Investment Strategy: 7 Critical Lessons from the War Economy (2026)

About the Author: Rayhan Ferdous
Rayhan is the Senior Content Author and Fact-Checking Lead at globalinvestmentreviews.com. An MBA in Accounting and a Portfolio Manager since 2022, he specializes in verifying complex financial data and simplifying market insights for investors of all levels.