Indices
Explore major global market indices, including the S&P 500 and FTSE 100, with market overview charts and analysis from GIR Finance.
How to read global market indices
A stock-market index tracks a defined group of securities using a stated weighting method. It is a useful snapshot of a market segment, but it is not the same as the whole economy and it does not represent every listed company. A large-cap index may be dominated by a small number of very large constituents, while an equal-weighted or small-company benchmark can tell a different story.
Use the chart below as a starting point rather than a stand-alone investment signal. Before comparing two indices, check their constituents, weighting rules, currency, price-return versus total-return basis, and observation period. A headline move can look different once dividends, exchange rates, trading hours and sector concentration are taken into account.
Five checks before drawing a conclusion
- Confirm the benchmark. Check the exact index name, ticker, exchange and the securities it represents.
- Match the time window. Compare identical dates and note whether the displayed value is delayed, intraday or a closing level.
- Check the return definition. Price-only charts may exclude dividends; total-return series can produce a different comparison.
- Account for currency and concentration. A foreign index’s local-currency result may differ from a home-currency investor’s result, and a few constituents can drive much of the move.
- Separate observation from forecast. A chart shows past or current market data; it cannot establish what returns will be or whether an asset suits a particular investor.
The interactive panel is provided by a third-party data service. GIR does not independently calculate or audit every quote shown in the widget, and data availability, timing and symbol coverage may vary. Verify material market figures with the index administrator, exchange, fund provider or another authoritative source before relying on them.
For a deeper look at index selection and comparisons, see the global indices analysis guide. You can also compare market regions through the market heatmap; neither chart nor heatmap should be treated as personalised financial advice.
Global Market Indices
Live performance of world stock markets. Select a region below.
Related Resources
Global Market Indices Analysis
Explore global market indices with charts and practical analysis of index construction, market breadth, volatility and sector composition. Data timing depends on the market-data provider.
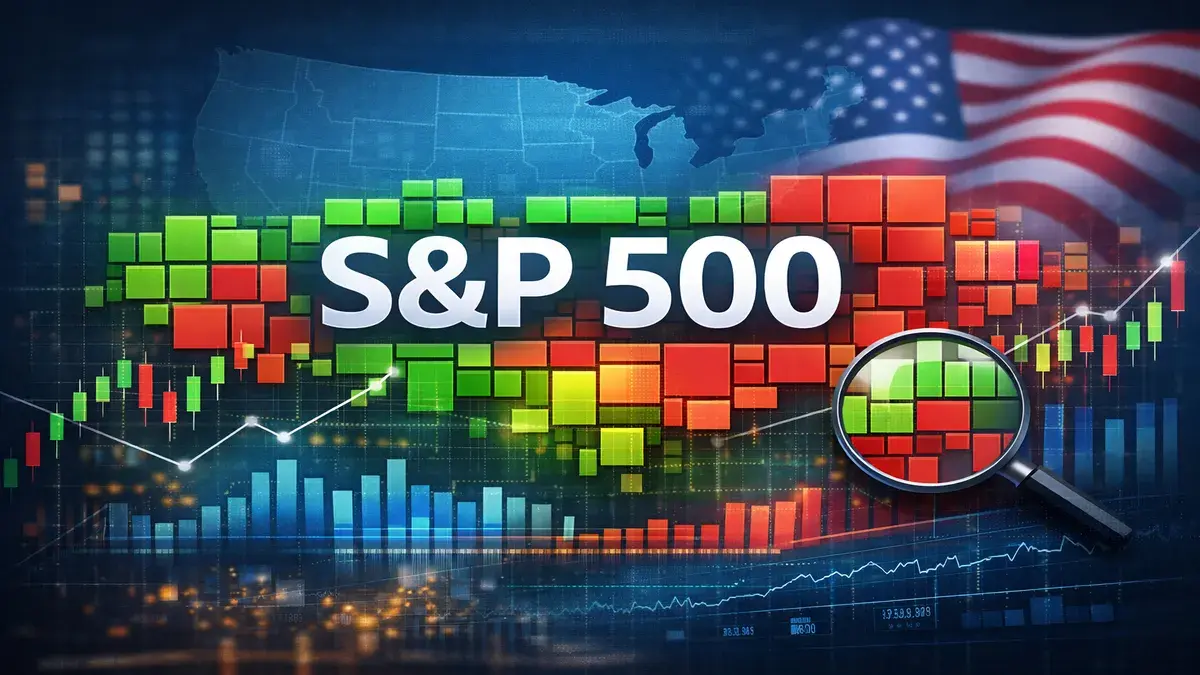
S&P 500
S&P 500 heatmap for visual research into constituent moves, market breadth and relative performance. Review the selected data source, metric and period before drawing conclusions.
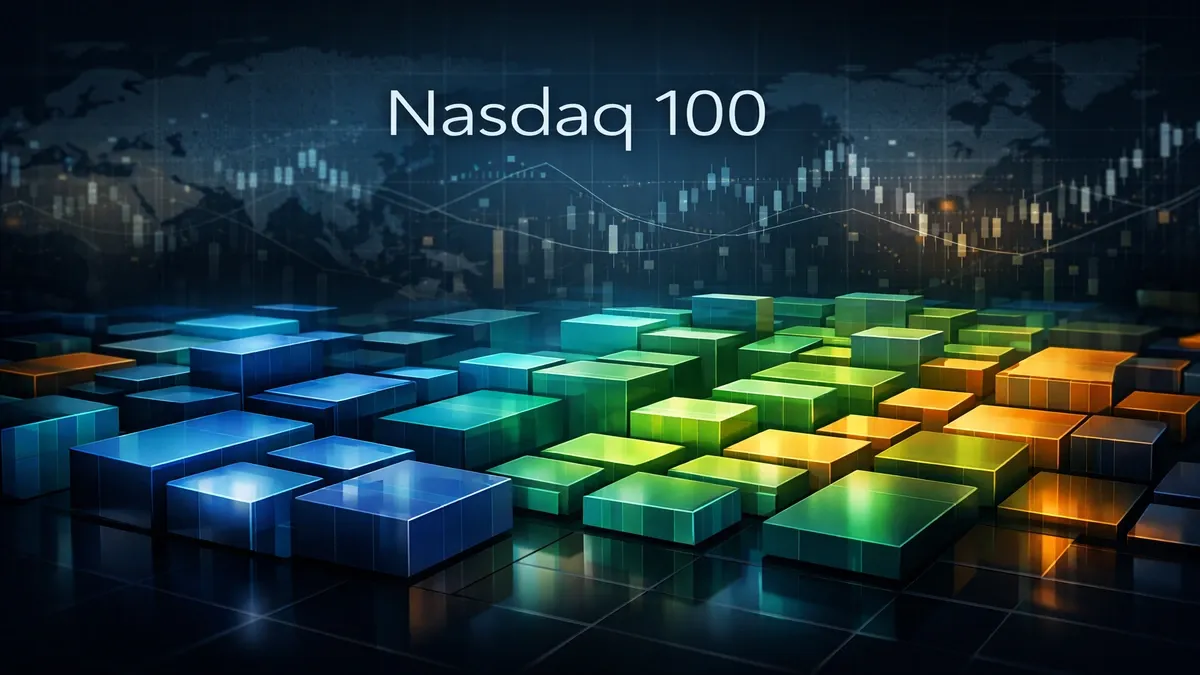
Nasdaq 100
Nasdaq 100 heatmap for visual research into constituent moves, market breadth and relative performance. Review the selected data source, metric and period before drawing conclusions.