
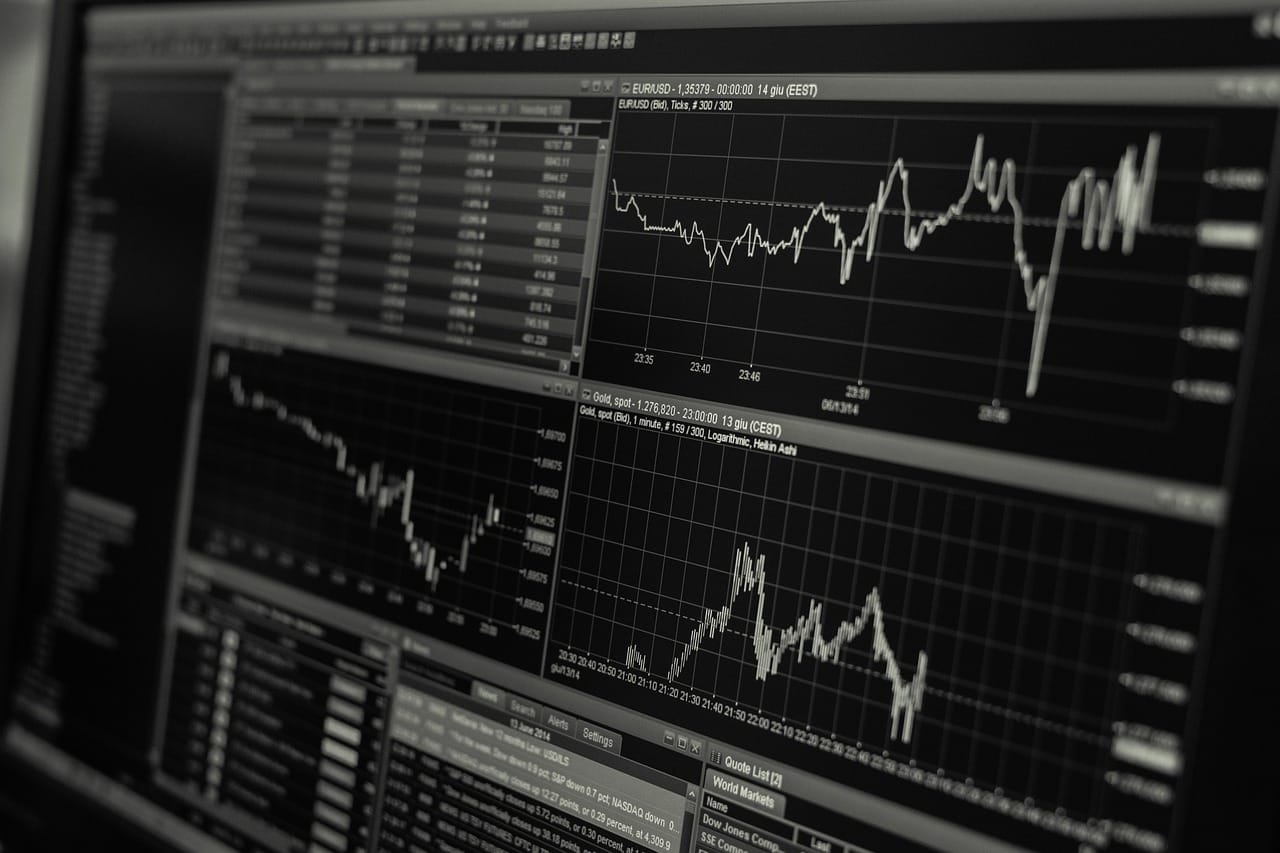
Investment Performance Charts
Real Estate Investment Trust Performance Charts
Analyze institutional REIT performance charts, commercial real estate yields, and sector benchmarks to optimize portfolio allocation strategies.
Section
11 articles in Visual Intelligence
Investment Performance Charts
Analyze institutional REIT performance charts, commercial real estate yields, and sector benchmarks to optimize portfolio allocation strategies.

Investment Performance Charts
Explore Municipal Bond Yield Curves with this institutional analysis covering macro drivers, credit spreads, tax mechanics, and cross-border value.
Investment Performance Charts
Examine how institutional investors utilize equity index performance charts to evaluate market benchmarks, track returns, and optimize allocations.
Investment Performance Charts
Analyze private equity performance charts, IRR benchmarks, MOIC metrics, and institutional portfolio evaluation frameworks for alternative assets.

Global Economy Maps
Map the key trade corridors: Suez, Panama, Malacca and Hormuz, the alternatives growing around them, and how routes are financed and risk-checked.
Investment Performance Charts
Analyze Sovereign ESG Performance Charts to evaluate green bond spreads, sustainability metrics, and fixed income risk across global debt markets.

Investment Performance Charts
Examine Sovereign Bond Performance Charts to analyze government debt yields, yield curve shifts, and macroeconomic risk pricing for institutional portfolios.

Investment Performance Charts
Examine yield curve performance charts and term structure shifts to optimize fixed income allocation strategies in evolving macroeconomic cycles. yield curve ch

Global Economy Maps
How pipelines, power interconnectors, hydrogen and carbon corridors are financed and built, and the questions that decide whether a project goes ahead.

Global Economy Maps
Where critical minerals and chips are mined, processed and made, why the chains are so concentrated, and how governments and investors are responding.

Global Economy Maps
Analyze the evolution of global digital trade corridors in 2026. Explore infrastructure, cross-border data flows, and institutional investment strategies.