From Global Trends to Details
A practical, original guide to reading market heatmaps from broad participation and sector patterns down to individual securities.
From Global Trends to Details: A Practical Heatmap Workflow
A market heatmap is most useful when it is treated as a starting point for investigation, not as a final answer. It compresses many observations into one visual field, making broad patterns easier to notice. A disciplined reader then moves from the overall picture to groups, individual names and finally the underlying data.
1. Begin with the market-wide picture
Before focusing on a single tile, look at how much of the map appears positive, negative or relatively unchanged. A market in which many areas share the same direction may be behaving differently from one where gains and losses are scattered. This first pass is about breadth: how widely a move appears to be shared, rather than which symbol has the most dramatic colour.
Keep the time horizon in mind. A daily change can look very different from a one-month performance view. Make sure the selected period matches the question you are trying to answer.
2. Compare groups before choosing a symbol
Where the view is arranged into sectors, industries or other categories, compare those clusters. Ask whether one group is moving differently from its peers, whether the largest tiles dominate the pattern, and whether the apparent strength is broad or concentrated in a few names. Group comparisons can help separate a market-wide theme from a company-specific move.
3. Read size and colour as separate signals
Tile area usually represents the metric selected for sizing, while colour represents the selected comparison or performance metric. A large tile is not automatically a strong performer, and a bright tile is not necessarily a large part of the market. Read the legend and the active controls before drawing conclusions. If the map uses equal-sized tiles, visual area no longer communicates relative weight in the same way.
4. Inspect individual assets
Once a pattern stands out, hover over or select the relevant tile to inspect its label and available values. Check the exact percentage, the period being measured, and the size metric. If the site provides a dedicated asset page, continue there to review the company or instrument in context. The heatmap can help prioritize research; it cannot explain the cause of a move by itself.
5. Verify the story outside the map
Use exchange announcements, company filings, index-provider information and other primary material to check possible explanations. Confirm whether the instrument belongs to the expected market and whether the displayed data is current enough for your purpose. If several symbols move together, investigate common factors rather than assuming one company caused the wider pattern.
A repeatable review routine
- Choose the market and a relevant time period.
- Read the legend and confirm the size and colour metrics.
- Scan broad participation, then compare groups.
- Inspect a small number of notable symbols.
- Verify important observations with independent sources and record what remains uncertain.
This sequence keeps the map useful without giving visual signals more meaning than the data supports. It is an educational workflow, not a trading recommendation.
Further reading
For educational purposes only. Heatmap patterns are descriptive and should not be treated as a forecast or a substitute for independent research.
See Also
Related Resources
Heatmap
Track real-time stock market movements with our interactive heatmap. Visualize sector performance and market trends instantly at Global Investment Reviews.
Asian Dynamics
The Ultimate Investment in Singapore Guide: 10-Year Trends & Strategies for High Returns
Discover the Investment in Singapore Guide by Global Investment Reviews. Explore officially reported FDI data, tax-free growth, and residency through investment.
Economy
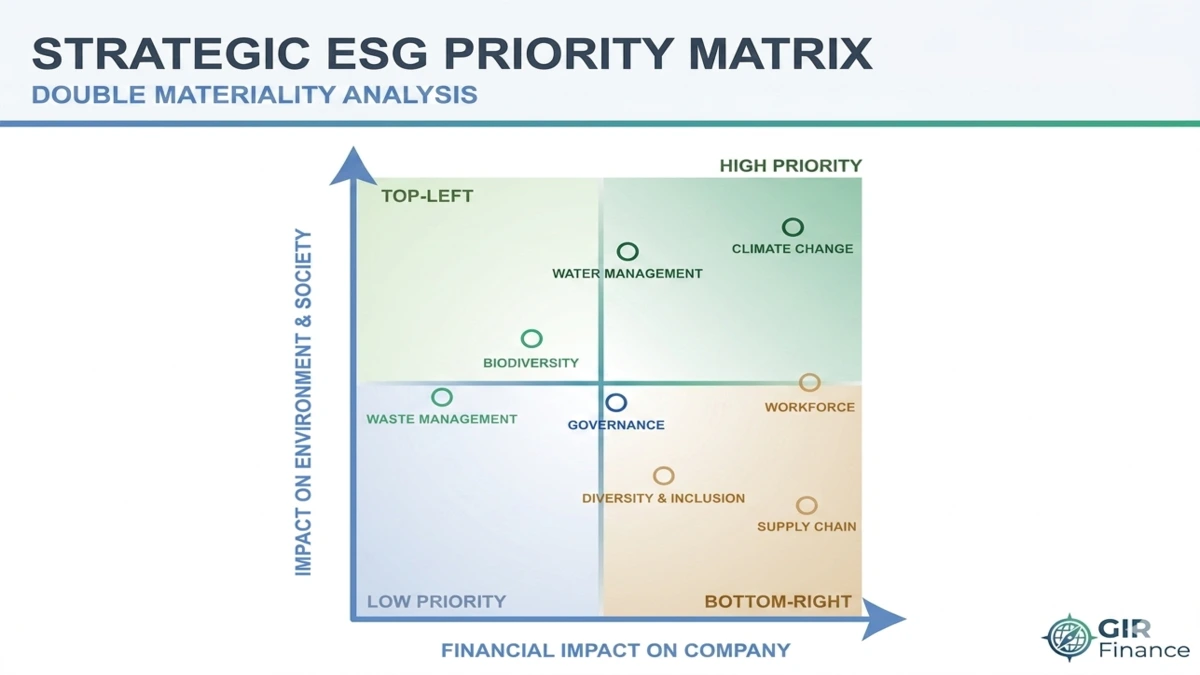
Sustainable Infrastructure Investment: The Institutional Mega-Guide
Explore sustainable infrastructure across energy, transport and utilities, including investment vehicles, policy drivers, valuation considerations and risks.