Sustainable Infrastructure Investment & ESG Yield Calculator
Model long-term portfolio yields and ESG carbon offset metrics with our institutional-grade sustainable infrastructure investment calculator. Free asset modeling asset.
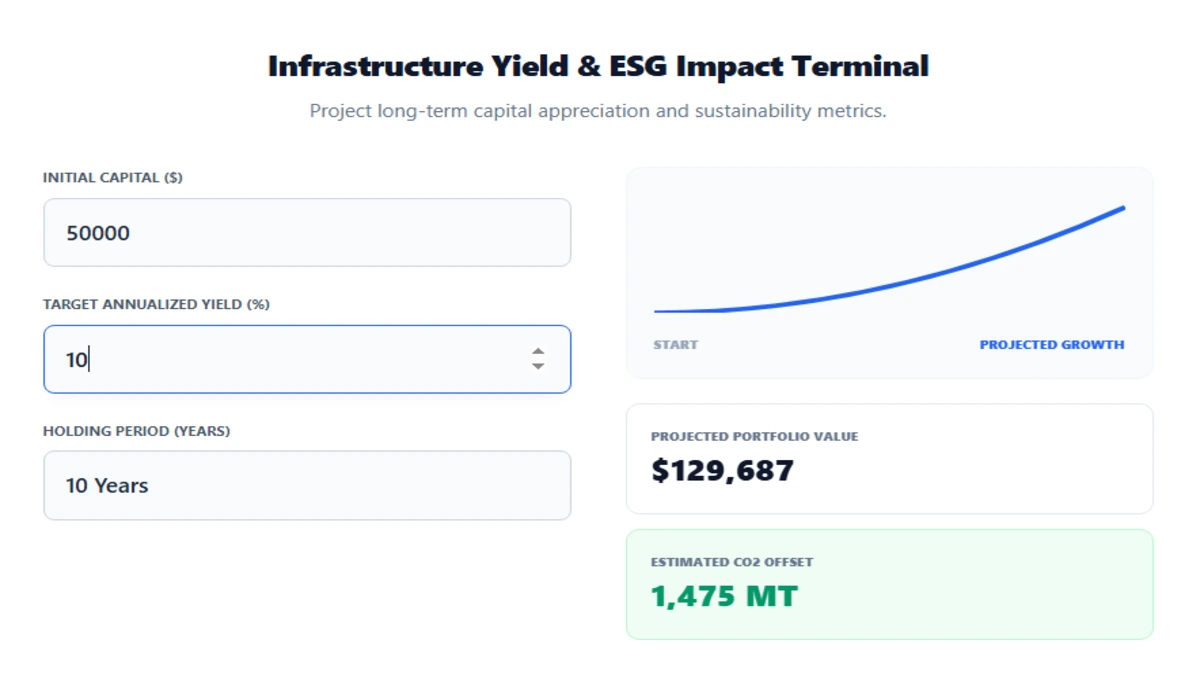
Infrastructure & ESG Impact Terminal
Investment Disclosure: This Infrastructure Investment Calculator simulates compounded annual yields alongside ESG metric proxies for educational purposes only.
For a deep-dive analysis on how global funds utilize these metrics, read our full guide on Sustainable Infrastructure Investment.
Dynamic Alternative Asset Modeling Terminal
Welcome to the GIR Finance terminal, featuring our proprietary sustainable infrastructure investment calculator. This specialized green infrastructure compounding tool is engineered for institutional allocators, family offices, and high-net-worth individuals (HNWIs) looking to baseline the financial and environmental performance of potential sustainable infrastructure real-assets.
Unlike traditional equities, long-duration alternative assets operate under complex Power Purchase Agreements (PPAs) and regulated multi-decade tariffs. Analysts can utilize this flexible infrastructure yield calculator to model how initial capital deployments compound over target holding periods. Beyond pure financial projections, the interface integrates an institutional-grade ESG carbon offset model to simultaneously track environmental metrics, delivering a baseline project finance IRR simulation that bridges yield optimization with carbon mitigation targets.
Methodology and Structural Mechanics
The Dual Materiality of Infrastructure Allocations
In modern asset management, financial returns and environmental impacts are no longer evaluated in silos. This model utilizes an institutional compounding framework alongside proxy data for clean-energy carbon offsets. For every $100 allocated annually to diversified sustainable infrastructure—such as utility-scale solar arrays, offshore wind networks, or smart grid transmission lines—the model estimates a proxy carbon mitigation rate of approximately 0.295 Metric Tons of CO2.
De-risking Capital Projections
While this calculator provides a robust baseline for annualized compounding yields, true project finance requires cross-referencing localized macroeconomic and regulatory conditions. Real-world internal rates of return (IRR) are inherently shaped by:
- Contractual Escalators: Built-in CPI or inflation indexation within 15-25 year corporate PPAs.
- Sub-Sector Volatility: The distinct risk-reward curves differentiating stable brownfield water utilities (typically 3-6% yields) from higher-margin, merchant-risk utility battery storage deployments (targeting 8-12% yields).
- Policy Backstops: Long-term fiscal incentives such as the US Inflation Reduction Act (IRA) tax credits or European Green Deal state aids that fundamentally shift the asset downside.
Automating Allocation Workflows
Efficiently deploying capital into long-duration infrastructure requires precise liquidity management and forecasting. Beyond macroeconomic modeling, modern allocators are shifting toward automated tools to track operational treasury and real-time portfolio cash flows. To optimize your broader asset allocation strategies and leverage predictive fintech, explore our analytical review of Automated Budgeting AI Apps: The Digital Finance Vanguard to streamline your capital deployment workflows.
Operational Framework: How to Utilize This Predictive Model
To extract maximum strategic value from this interface, institutional analysts and wealth managers should evaluate inputs through a three-tiered risk framework:
- Capital Baseline ($): Input your net liquid capital earmarked for alternative asset deployment. This model treats the input as early-stage greenfield development capital or brownfield secondary-market acquisition costs.
- Yield Selection (%): Align your target yield with current market realities. Adjust the baseline downward (3–6%) for regulated utilities with rock-solid downside protection, or scale upward (8–12%) for merchant battery storage and ancillary grid services exposed to localized pricing volatility.
- Horizon Alignment (Years): Match the holding period with actual asset lifecycles. Institutional Power Purchase Agreements (PPAs) typically operate on 15-to-20-year horizons, making the longer tenors ideal for pension funds looking to match long-duration liabilities.
Critical Risk Disclosures & Institutional Due Diligence
In strict compliance with global financial reporting standards, users must recognize that algorithmic simulations cannot substitute for rigorous, project-specific due diligence. Sustainable infrastructure as a real asset class is subject to structural variables that can alter the real Internal Rate of Return (IRR):
- Grid Interconnection & Curtailment Risk: A project’s theoretical capacity factor can be significantly bottlenecked by regional grid congestion. If the local transmission network cannot absorb surplus renewable generation, operators face zero-revenue curtailment periods.
- Regulatory and Subsidy Evolution: While current policy tailwinds like the US Inflation Reduction Act (IRA) offer unprecedented tax credit visibility, infrastructure assets outlive political cycles. Shifting fiscal policies or mid-stream tariff revisions pose an inherent regulatory risk.
- Technological Obsolescence: The rapid cost-compression of alternative assets (such as solar PV efficiencies and next-generation long-duration energy storage) implies that assets deployed today may face stiff cost-competition from technologically superior installations a decade from now.
Verification & Data Integrity Statement
At Global Investment Reviews (GIR), we prioritize institutional transparency. The financial compounding algorithms utilized in this interface follow standard discrete annual compounding formulas:
Where:
- A represents the final Projected Portfolio Value.
- P is the Initial Capital Allocation.
- r is the Target Annualized Yield.
- t is the Holding Period in years.
The environmental mitigation matrix uses established global proxy data, matching annualized clean-energy capital deployment against regional grid displacement averages. This mathematical modeling is routinely reviewed by our in-house financial analysts and external tax specialists to maintain data integrity and protect our users from speculative forecasting.